Microsoft Excel Dashboard Templates
- Dashboards designed for and compatible with Microsoft Excel reporting
Dashboards provided for free by contributors and partners

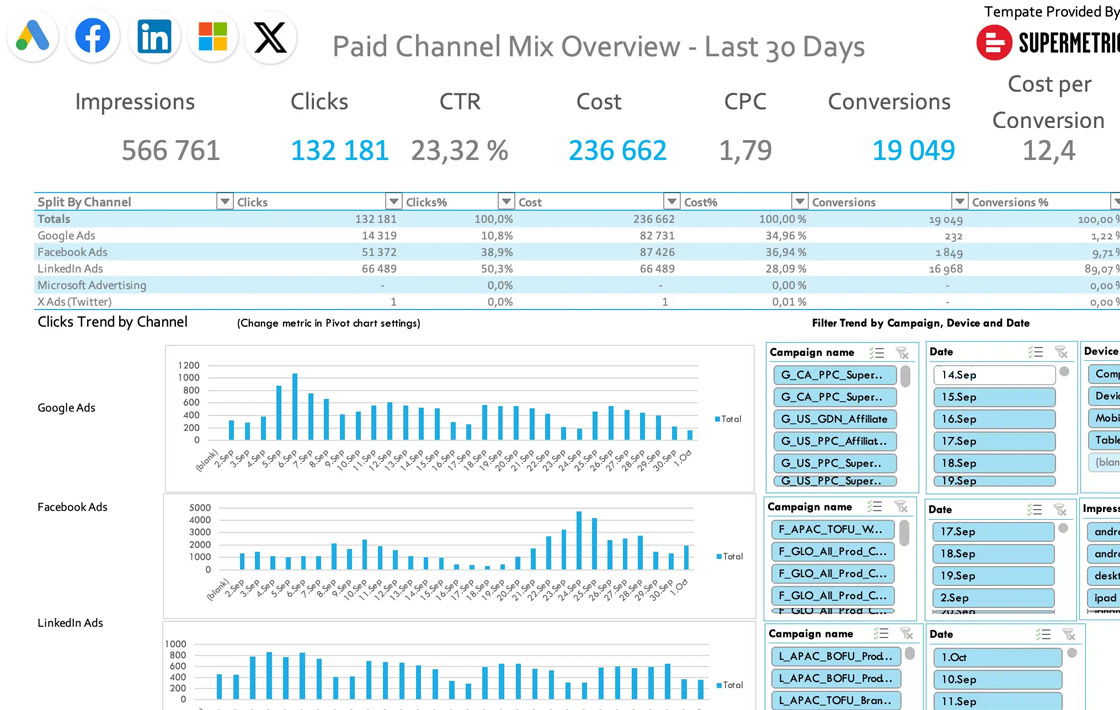
Paid Media Reporting
Microsoft Excel Template
- Data Source(s): Facebook + Instagram Ads (Meta),Google Ads,LinkedIn Ads,Microsoft (Bing) Ads,Twitter (X) Ads
- Destination: Microsoft Excel
Price: Free
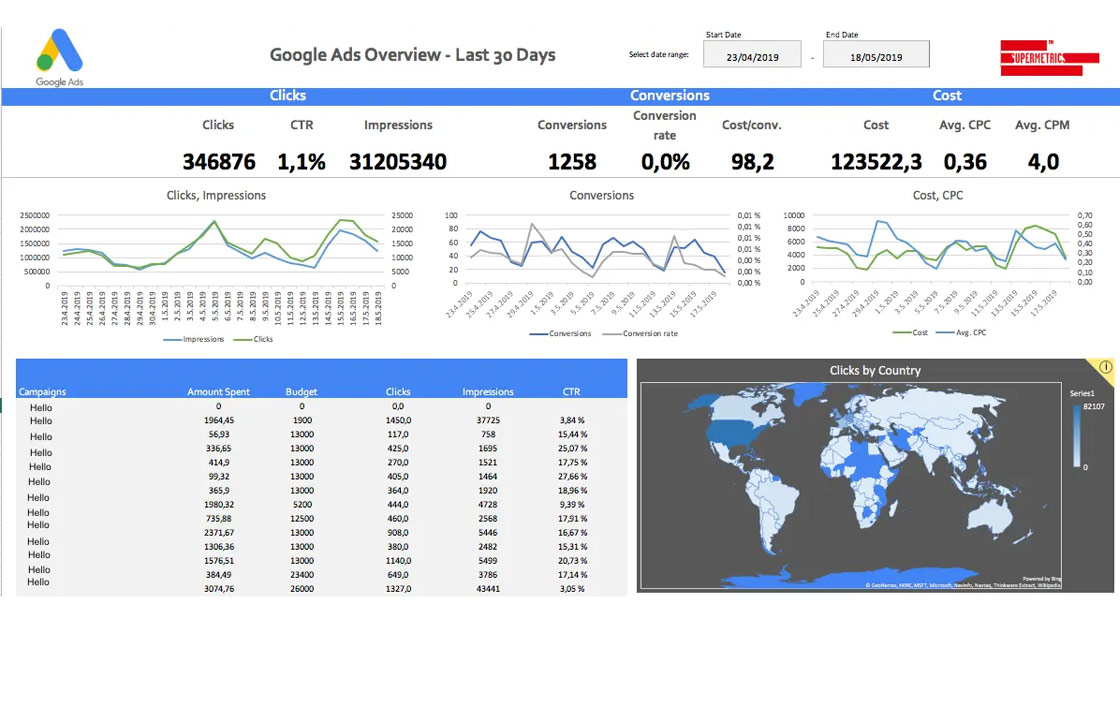
Google Ads Reporting
Microsoft Excel Template
About Microsoft Excel
Microsoft Excel is one of the most widely used spreadsheet applications globally, renowned for its versatility in data analysis, reporting, and visualization. Marketers, analysts, and business professionals rely on Excel for its powerful calculation capabilities, extensive data manipulation tools, and flexibility in customizing reports to suit specific needs. Excel’s robust formula functions, pivot tables, and charting tools allow users to handle large datasets, perform complex calculations, and create detailed visualizations for deeper data insights.
Excel also integrates well with other Microsoft products, enabling seamless data exchange with tools like Power BI and Microsoft Access, and it’s highly compatible with various file formats, making it easy to import and export data across platforms. Additionally, advanced users can take advantage of Excel’s Visual Basic for Applications (VBA) for custom macros, enabling automated workflows and repetitive task management.
Our site offers a selection of free, pre-built Excel dashboards crafted to simplify data reporting for marketers. These templates are designed to streamline your analytics by automatically updating key performance metrics, visualizing campaign data, and highlighting actionable insights, all within Excel’s familiar interface. With our Excel dashboards, you can easily track performance, analyze trends, and make data-driven decisions without the hassle of building reports from scratch.


