Power BI Dashboard Templates
- Dashboards designed for and compatible with Power BI reporting
Dashboards provided for free by contributors and partners

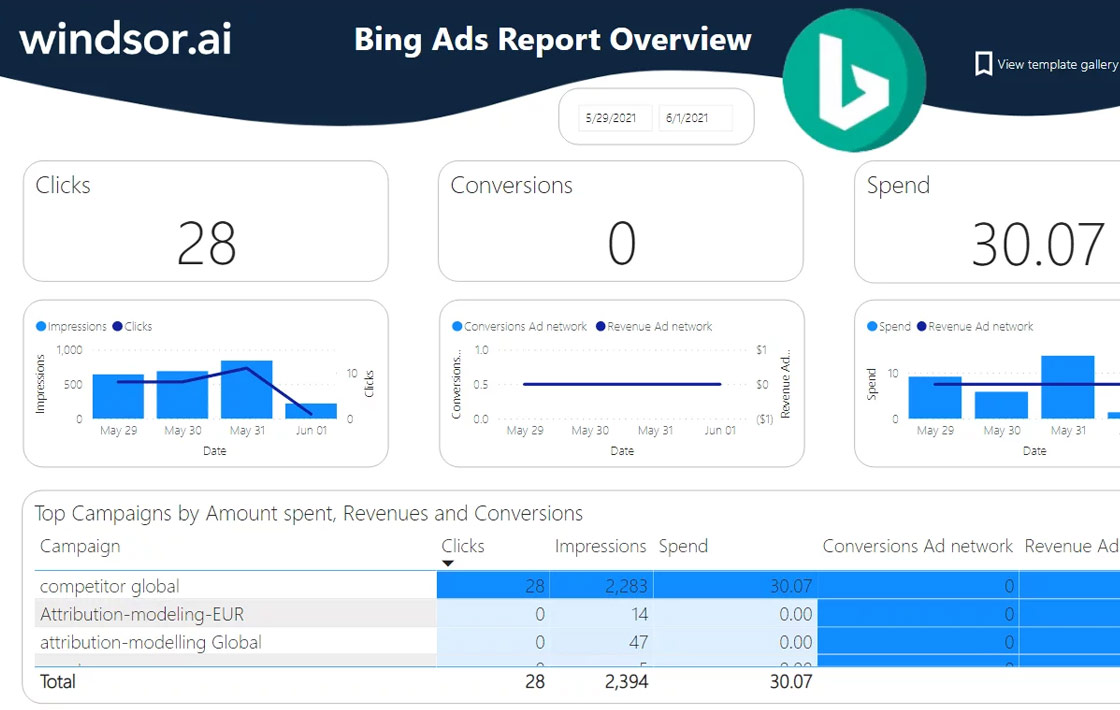
Bing Ads Analysis
Power BI Template
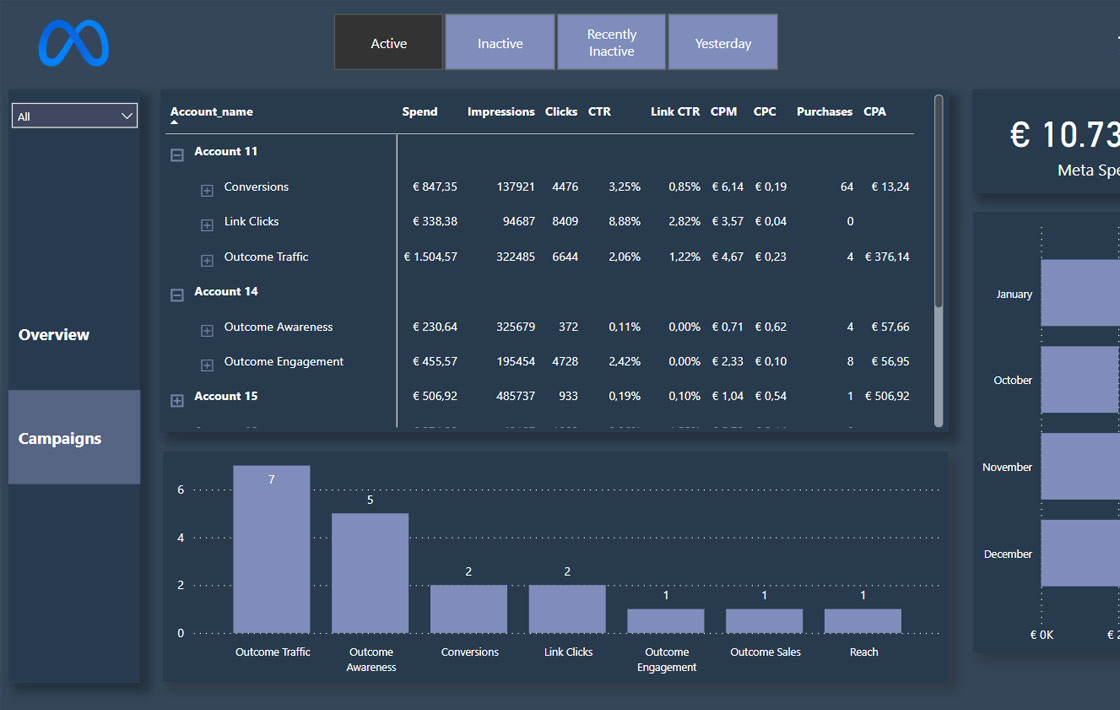
Meta Ads
Power BI Template
- Data Source(s): Facebook + Instagram Ads (Meta)
- Destination: Power BI
Price: Free
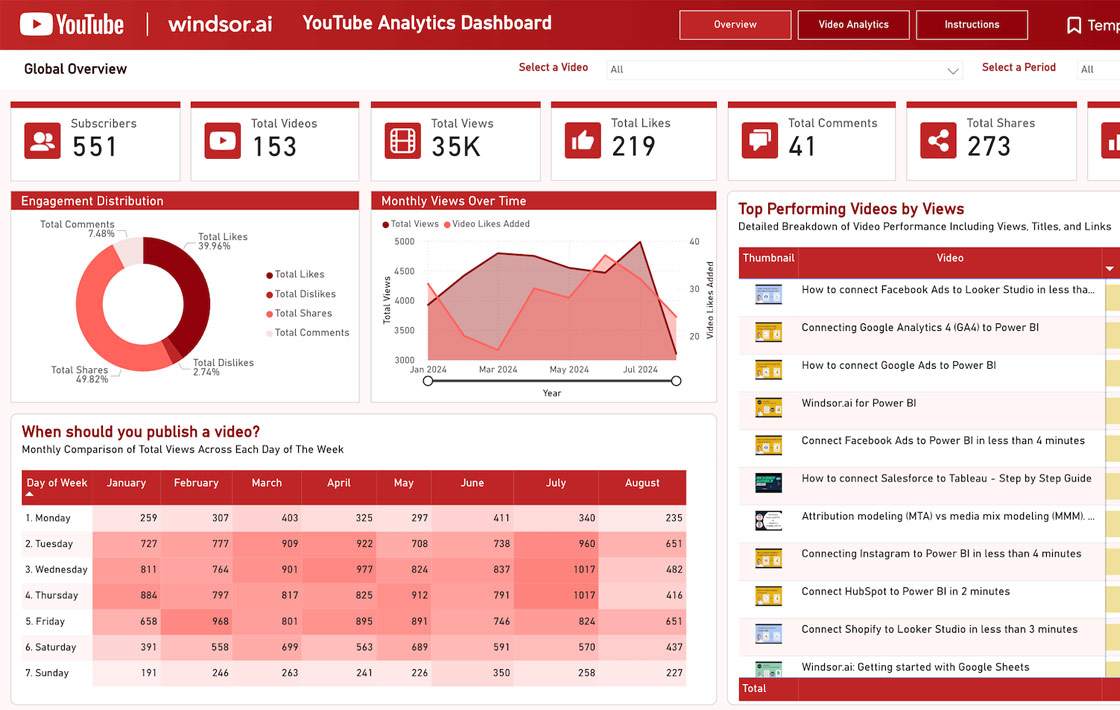
Youtube Video Analytics
Power BI Template
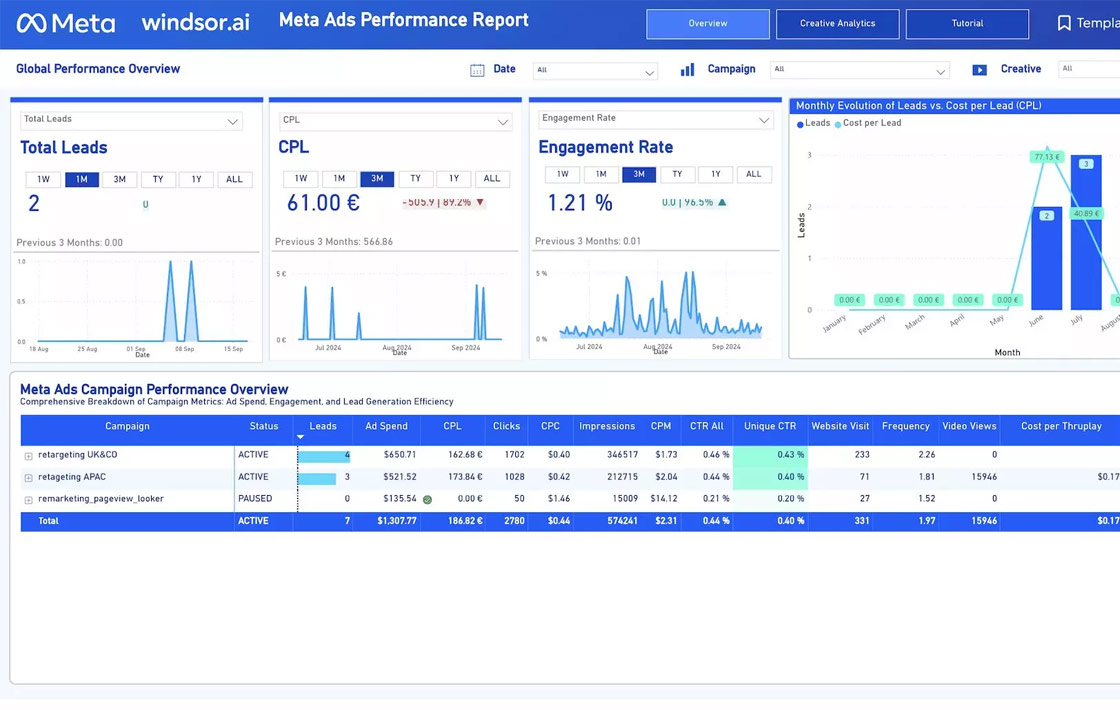
Facebook Ads Lead Generation
Power BI Template
- Data Source(s): Facebook + Instagram Ads (Meta)
- Destination: Power BI
Price: Free
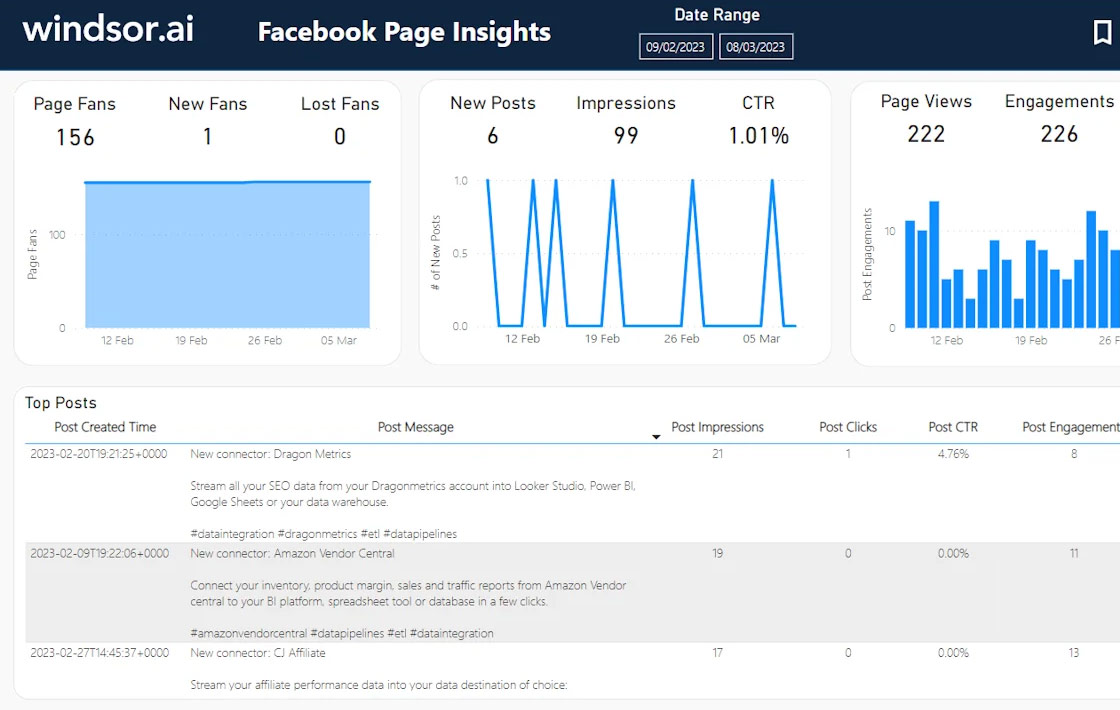
Facebook Page Insights
Power BI Template
- Data Source(s): Facebook Insights
- Destination: Power BI
Price: Free
About Power BI
Microsoft Power BI is a leading business intelligence and data visualization tool, built to transform raw data into actionable insights. Known for its robust data analysis capabilities, Power BI enables marketers, analysts, and business leaders to create dynamic, interactive dashboards and reports that reveal trends, patterns, and KPIs at a glance. Power BI’s seamless integration with Microsoft’s ecosystem, including Excel, Azure, and SQL Server, makes it a preferred choice for companies already using Microsoft products.
Power BI’s standout features include real-time data streaming, data blending, and AI-powered data insights, empowering users to make quick, informed decisions. It supports a wide range of data sources, from databases and spreadsheets to cloud-based services, making it versatile for any data-driven environment. With Power BI’s drag-and-drop functionality, users can easily customize dashboards with interactive visuals, charts, and graphs, and use DAX (Data Analysis Expressions) for in-depth calculations and data transformations.
To help you leverage the power of this tool effectively, our site provides a selection of free, pre-built Power BI dashboards tailored to marketing needs. Each dashboard template is designed to simplify complex data, offering clear visualizations of performance metrics, trends, and insights in a single, easy-to-navigate view. These templates save you time and help focus your efforts on analyzing and optimizing marketing strategies, so you can achieve your goals with greater efficiency and clarity.

